

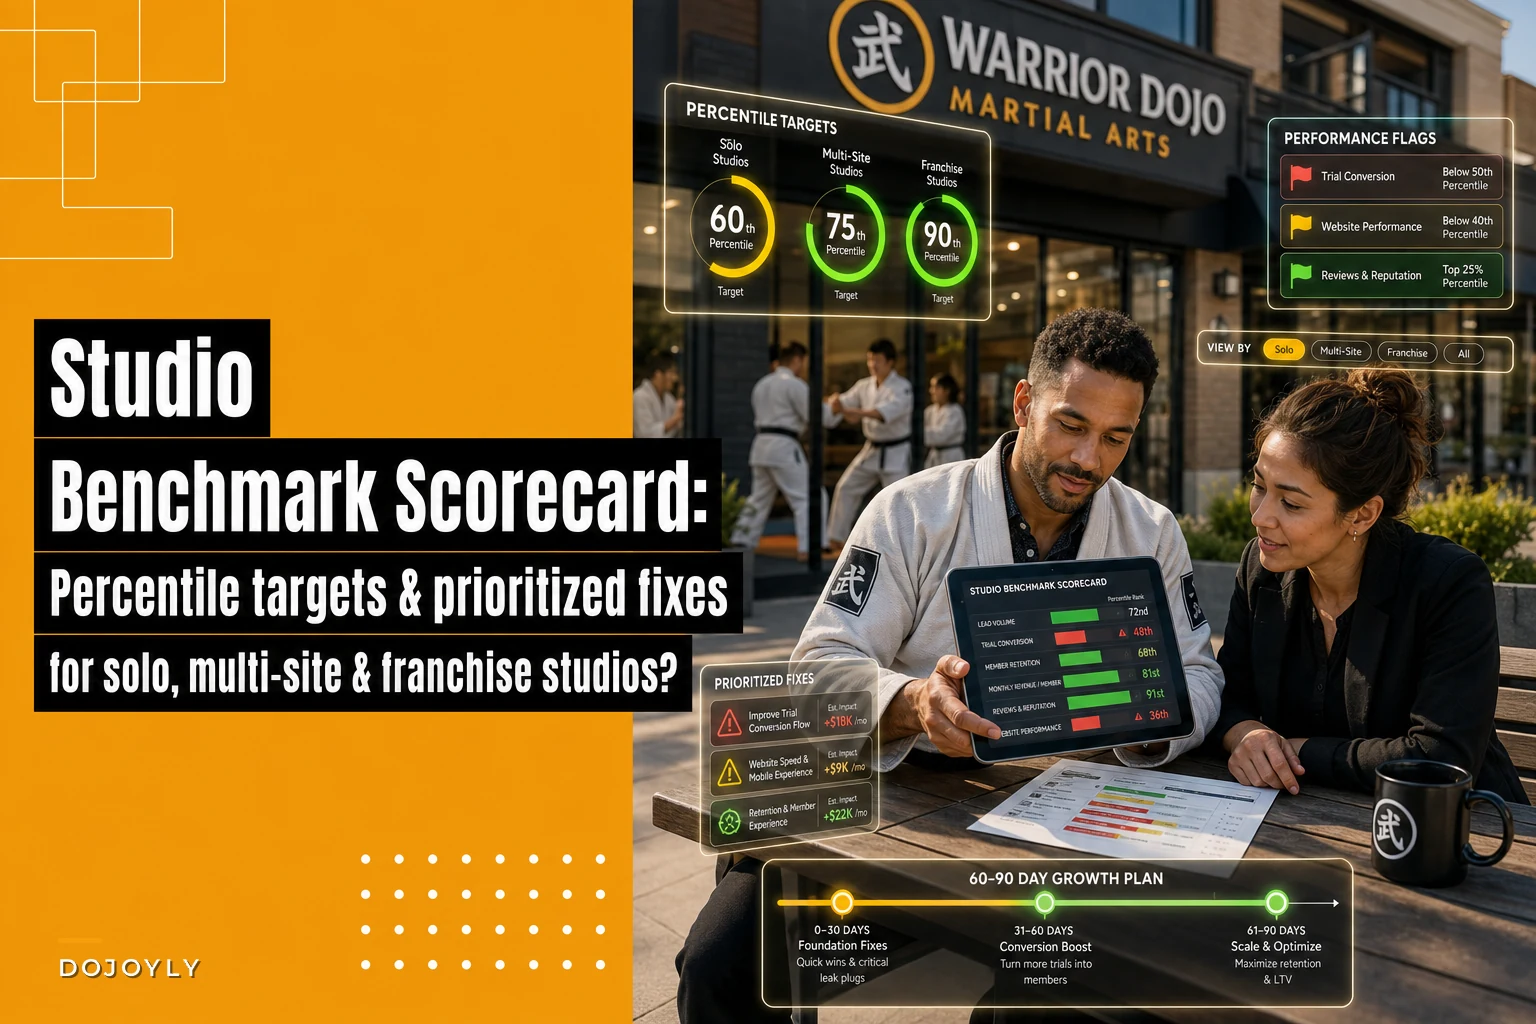

Most benchmark articles for martial arts studios hand you a single "industry average" and walk away. That number is basically useless. A solo instructor teaching 55 students out of a shared community-center room is a completely different animal than a three-location franchise doing $1.4M a year with a full front-desk team. Comparing them against the same retention target is how owners end up chasing the wrong problems.
This scorecard is built differently. The benchmarks below are segmented by studio size, and instead of just telling you what "good" looks like, it shows you which underperforming metric to fix first — because you can't fix everything at once, and the order matters more than most owners realize.
Why one benchmark number breaks down across studio sizes
The metrics that make or break a studio shift as you grow. That sounds obvious, but the way it plays out in practice surprises people.
A solo studio lives and dies on retention and instructor capacity. There's no team to absorb churn, so losing four students in a month is a real dent in take-home pay. Admin efficiency barely matters at that scale — the owner is the admin, and they know every student by name.
Flip to a franchise, and retention still matters, but now the real killers are consistency between locations and how much revenue leaks through billing failures and unowned handoffs. A franchise can have great retention at Location A and quietly bleed at Location C for six weeks before anyone notices, because no single person is watching the whole board.
That's why a blended average lies to you. When you average a solo studio's 91% retention against a franchise's 78% and a struggling second-site launch at 64%, you get a meaningless middle number that no real studio should be aiming for.
One pattern worth naming: the metrics you're weakest at usually aren't the ones you feel weak at. Owners obsess over lead volume because it's visible and stressful. But across studios of every size, the quiet killers are trial-to-paid conversion and the first 90 days of retention — the stuff that happens after the lead already walked in.
The percentile targets by studio size
Here's the scorecard core. Numbers are drawn from anonymized operational patterns across studios in the three size bands. Treat the percentiles as "how you stack up against studios your size," not against the whole industry.
Simplify class bookings and attendance tracking.
Dojoyly helps you schedule, confirm, and manage every class effortlessly.
- Unified class & student management
- Automated member notifications
- Instructor scheduling & availability
No credit card required
| Metric | Studio size | 25th pct (needs work) | 50th pct (median) | 75th pct (strong) | 90th pct (top) |
|---|---|---|---|---|---|
| Monthly retention | Solo | 92% | 94% | 96% | 97%+ |
| Monthly retention | Multi-site | 88% | 91% | 93.5% | 95%+ |
| Monthly retention | Franchise | 85% | 89% | 92% | 94%+ |
| Trial → paid conversion | Solo | 38% | 50% | 62% | 72%+ |
| Trial → paid conversion | Multi-site | 34% | 46% | 58% | 68%+ |
| Trial → paid conversion | Franchise | 30% | 42% | 54% | 64%+ |
| Failed-payment recovery | Solo | 45% | 60% | 72% | 82%+ |
| Failed-payment recovery | Multi-site | 50% | 65% | 78% | 88%+ |
| Failed-payment recovery | Franchise | 55% | 70% | 82% | 90%+ |
| Instructor utilization | Solo | 55% | 68% | 78% | 85%+ |
| Instructor utilization | Multi-site | 60% | 70% | 80% | 88%+ |
| Revenue per active student/mo | Solo | $95 | $125 | $155 | $185+ |
| Revenue per active student/mo | Multi-site | $105 | $135 | $165 | $195+ |
| Revenue per active student/mo | Franchise | $110 | $140 | $170 | $200+ |
A few things stand out when you actually look at this table.
Retention targets drop as you scale, and that's not a failure — it's structural. A solo instructor with a tight community naturally holds students better. A franchise trading intimacy for reach should expect a few points lower and build systems to compensate, not beat themselves up chasing solo-level numbers.
Failed-payment recovery moves the opposite direction. Bigger studios should be better here, because they have the volume to justify a real dunning process. If you're a franchise sitting at 55% recovery, you're not "average for your size" — you're leaving obvious money on the floor.
How to score yourself: the prioritized-fix method
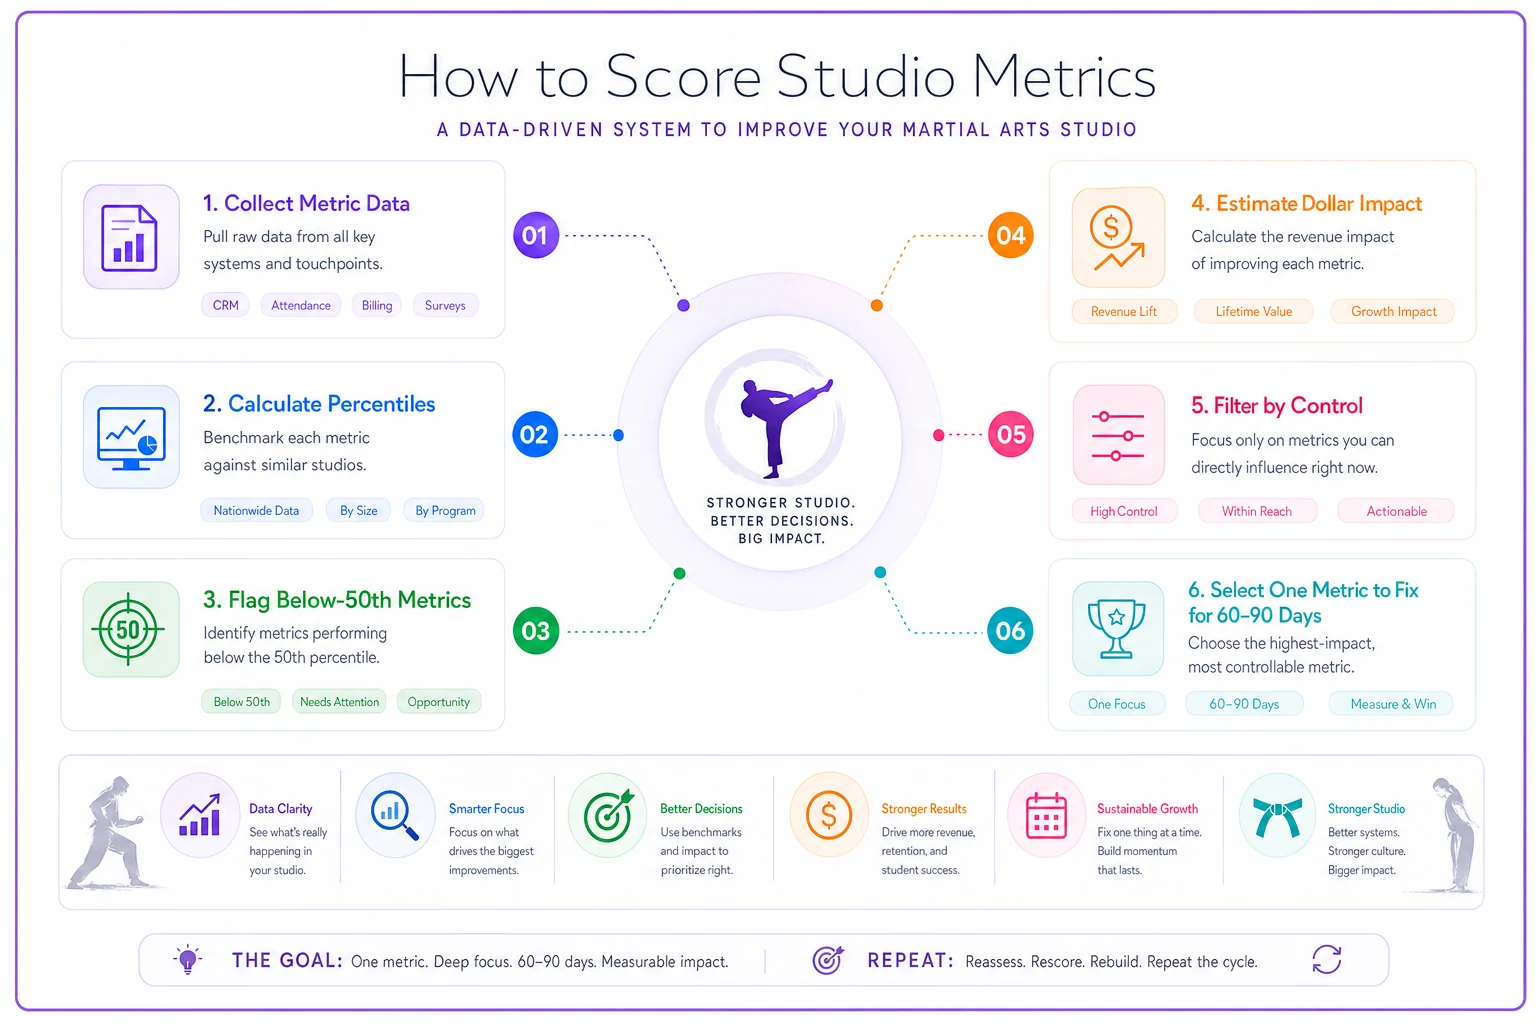
Don't fix the metric that's lowest. Fix the metric where a small move produces the biggest dollar swing and is realistically within your control this quarter.
-
Calculate your percentile for each metric using the table. Write down whether you're below 25th, between 25–50th, 50–75th, or above 75th.
-
Flag everything below the 50th percentile. These are your candidates. Ignore anything above 50th for now — polishing a strong metric is a distraction when something else is broken.
-
Estimate the dollar impact of moving each flagged metric up one band. A 3-point retention gain on 300 students is worth far more than a 10-point conversion gain on 12 trials a month. Do the math, don't guess.
-
Filter by control. Failed-payment recovery and no-show reduction are almost entirely within your control. Lead volume depends on marketing spend and market conditions — harder to move fast. Prioritize the controllable ones.
-
Pick exactly one metric to attack for the next 60–90 days. One. Studios that try to fix five things fix zero.
Sketch this process out to keep the team aligned.
The mistake that comes up constantly: owners at the 40th percentile on retention and the 20th percentile on conversion pour all their energy into conversion, because it feels like the newer, more urgent problem. But if you've got 300 students, that retention gap is quietly worth three to five times what the conversion gap is. The scorecard exists to stop you from working hard on the wrong number.
Remedies for the metrics studios most often underperform
Once you've picked your one metric, here's what actually moves it — organized by the problems that show up most across the three size bands.
Retention below the 50th percentile
-
Audit the 30–90 day window first. Most churn isn't happening at month 8. It's happening early, before habit forms. If you don't know your churn by tenure, you're flying blind.
-
Build a re-engagement trigger at the first missed week. A student who misses two consecutive weeks is far more likely to quiet-quit. Reaching out at week one, not month two, is the whole game.
-
For multi-site
check retention per location, never blended.
A blended 91% can hide a location running at 82%.
The student lifecycle framework tied to curriculum and billing goes deep on exactly where students fall out and how to catch them before they're gone.
Failed-payment recovery below the 50th percentile
-
Map how many charges fail per month and how many you currently recover. Most studios have never actually counted.
-
Set retry timing that avoids the exact days cards commonly fail again — retrying after a paycheck cycle lands works better than same-day retries.
-
Add a human follow-up step for cards that fail twice. Automation catches the easy ones, but the stubborn 20% need a text or call.
Track recoveries weekly for a month after workflow changes to see which retry timing nets the biggest lift.
Recovering even 15 more percentage points on failed payments often outperforms a whole marketing push, because that revenue is already yours — it just didn't land.
Trial-to-paid conversion below the 50th percentile
-
Look at time-to-ask. Studios that convert well make the membership ask inside the trial window, not after it lapses.
-
Standardize the trial experience so it doesn't depend on which instructor happened to teach that day.
-
Track conversion by lead source — sometimes your "conversion problem" is actually a lead-quality problem from one bad channel.
Instructor utilization below the 50th percentile
-
Overlay your class schedule against actual attendance heatmaps. Half-empty classes at awkward times drag utilization down and quietly bleed payroll.
-
Consolidate low-attendance slots before adding new ones.
If you're carrying classes that lose money on a per-head basis, the studio financial operations playbook on per-class losses breaks down how to spot and cut them without gutting your schedule.
A real scenario: multi-site studio, two locations, stuck at the median
A two-location studio with roughly 290 active students scored themselves against this table. Their numbers came back like this:
-
Retention
90% (50th percentile — median, fine)
-
Trial conversion
44% (just under median)
-
Failed-payment recovery
52% (25th percentile — clearly weak)
-
Revenue per student
$138 (right at median)
Their instinct was to fix conversion, because enrollment felt slow. But the dollar math told a different story. At 290 students paying around $138/month, they were running roughly $40k in monthly recurring revenue. With a failure rate of about 6% and only 52% recovery, they were losing close to $1,100–$1,300 a month to charges that failed and never got chased.
They spent one quarter on nothing but payment recovery — better retry timing, a two-strike human follow-up, and a weekly review of the failed-charge list. Recovery climbed to around 74%, which recovered roughly $700–$900 a month they'd been quietly eating, with zero new marketing spend and no new students through the door.
The conversion problem was still there. But it wasn't the first problem. That's the entire point of scoring by dollar-impact instead of by gut feel.
When this scorecard actually helps — and when to ignore it
When it makes sense: You've got at least a few months of clean data and you're feeling scattered — juggling five improvement projects and finishing none. The scorecard forces a single priority. It's also useful right before an expansion decision, because it tells you whether your current operations are strong enough to duplicate or whether you'd just be copying broken processes to a new address.
When it's a bad idea: If your data is a mess, benchmarking is premature. Percentiles are worthless if your retention number is wrong because your billing system and your attendance system disagree on who's active. Fix data integrity first, benchmark second.
Who should skip this for now: A brand-new studio in its first six months. Your numbers are too volatile, your student count too small, and one family moving away can swing your retention by five points. Focus on getting reps and clean records. Come back to the scorecard once you've got real volume behind the percentages.
Where the numbers usually live — and why that's the real bottleneck
The uncomfortable truth behind every underperforming metric on this scorecard is that most studios can't calculate them cleanly in the first place. Retention lives in one place, payment failures in another, attendance in a spreadsheet someone updates when they remember. Scoring yourself turns into a two-hour archaeology project, so nobody does it, so the weak metric never gets caught.
This is where having your operational data in one system stops being a nice-to-have. When enrollment, attendance, and billing all sit together — ideally in an AI-powered operational platform that flags anomalies automatically — pulling your percentile for each metric becomes a five-minute check instead of a manual reconciliation.
The scorecard only works if you can actually run it more than once a year, and that's a data-plumbing problem long before it's a strategy problem.
The one thing to do after reading this
Don't try to move all your numbers at once. Score yourself against your own size band, flag everything below the 50th percentile, and pick the single metric where a one-band improvement is worth the most real dollars and is within your control this quarter.
Then leave the rest alone until that one's fixed. The studios that grow steadily aren't the ones with perfect metrics across the board — they're the ones who correctly identify the one broken number that's quietly costing them the most, fix it, and only then move to the next. That's the whole job of this scorecard.
Don't try to move all your numbers at once. Score yourself against your own size band, flag everything below the 50th percentile, and pick the single metric where a one-band improvement is worth the most real dollars and is within your control this quarter.
Ready to elevate your dojo operations?
Join 500+ martial arts studios using Dojoyly to save time, reduce scheduling conflicts, and improve member engagement.