
Most martial arts studio owners think they understand their finances because they track total revenue and total expenses. They see $28,000 coming in monthly, $22,000 going out, and figure that $6,000 margin means things are working. But when you actually break down the numbers by class, the picture gets uglier fast.
Why most studio owners discover their real financial problems too late
Your kids' fundamentals class with 22 students? Profitable. The advanced adult Muay Thai session with 4 dedicated regulars? Bleeding $180 every single week. That specialty weapons class you added because three students begged for it? Costing you around $2,400 a year once you factor in instructor time, insurance riders, and equipment maintenance.
The problem isn't just unprofitable classes—it's that most studios run their entire martial arts studio financial operations without ever knowing which programs actually make money. Decisions get made based on gut feel, student requests, or what the studio down the street offers, not actual per-class economics. Then owners wonder why adding more classes doesn't translate to more profit.
Why traditional studio accounting creates operational blindness
Studio owners typically see their finances through one lens: the monthly P&L their accountant sends. Revenue minus expenses equals profit or loss. Clean, simple, and almost completely useless for day-to-day operational decisions.
Simplify class bookings and attendance tracking.
Dojoyly helps you schedule, confirm, and manage every class effortlessly.
- Unified class & student management
- Automated member notifications
- Instructor scheduling & availability
No credit card required
Think about what that monthly statement actually tells you. Rent was $4,200. Payroll hit $11,000. Insurance, utilities, equipment—all lined up neatly. But can you answer any of these: Which time slots generate the most profit per square foot? What's the real cost difference between running a 6-student class versus a 12-student one? How much revenue would you lose if you cut that Wednesday morning class with the inconsistent attendance?
You can't. Because the traditional approach treats your studio like a black box. Money in, money out, classes happen somewhere in between. This works fine for taxes. It's operational suicide when you're trying to scale.
What ends up happening: you notice Saturday kids' classes are packed, so you add another Saturday slot. Makes sense. Except that slot cannibalizes your existing classes, splits instructor resources, and increases your Saturday costs by 40% while only adding 15% more revenue. The decision looked smart. It quietly reduced your profitability.
Or promotion pricing. You run a "two months for $99" special that pulls in 30 new students. Then you find out 18 of them would've paid full price anyway. Now you've trained your market to wait for discounts, and your average customer lifetime value just dropped by a few hundred dollars—but you won't see that in your P&L for another four months.
The compounding effect of financial drift in growing studios
Small inefficiencies become serious problems as you grow. A class losing $50 weekly doesn't feel critical when you have 8 classes total. When you expand to 3 locations with 25 classes each, those same small losses compound into real cash flow problems.
A studio I looked at last year had grown from one location to three over 18 months. Revenue had tripled to around $84,000 monthly. But actual profit had dropped by $2,000. Why? They'd replicated their full class schedule at each new location—including every money-losing program. They were funding vanity classes at scale without realizing it.
The worst part about financial drift is that nothing looks wrong. Unlike a leaking roof, you don't see profit erosion happening. Classes still run. Students still pay. Instructors still show up. Everything appears normal while margins quietly compress.
It gets worse during growth periods. You're adding instructors, sometimes overpaying to ensure coverage. You're running small classes to claim new time slots. You're offering founder's rates and discounts to build enrollment. Individually, each decision makes sense. Collectively, they erode the unit economics that made your first location work.
Then there's scope creep. You add a kids' fitness program because parents asked. Anti-bullying workshops because schools expressed interest. Private lessons because three competitive students want extra attention. Before long you're running 15 different programs, half of which lose money, and your operational complexity has tripled.
Building a weekly financial rhythm that catches problems early
The fix starts with a financial cadence that actually matches how studios operate. Classes repeat weekly. Instructors get scheduled weekly. Most students train on consistent weekly patterns. Your financial tracking should match that rhythm, not some monthly reporting cycle.
Every Monday morning—before anything else—you need to look at three numbers: last week's collected revenue, last week's actual expenses, and your expected cash position for this week. Not estimates. Not projections. Actual money in and actual money out.
Here's the framework:
Monday: Cash Position Review Pull your bank balance, subtract pending charges (rent, payroll, auto-drafts), add confirmed incoming payments. That's your true available cash for the week. If it's below 1.5x your weekly operational cost, something needs immediate attention.
Wednesday: Revenue Checkpoint By Wednesday you should have collected roughly 40% of your weekly revenue target—from Monday and Tuesday classes, mid-week payment processing, any walk-in payments. If you're behind, find out why. Failed payments need immediate follow-up, not end-of-month cleanup.
Friday: Expense Reconciliation Review every expense that hit your accounts this week. Match against your approved categories. Flag anything unusual. This is also when you approve discretionary spending for the following week.
Sunday Night: Weekly P&L A simple one—revenue by source, expenses by category, calculated margins. Compare to the same week last month. This becomes your early warning system.
Visualize this weekly loop to keep the cadence consistent.
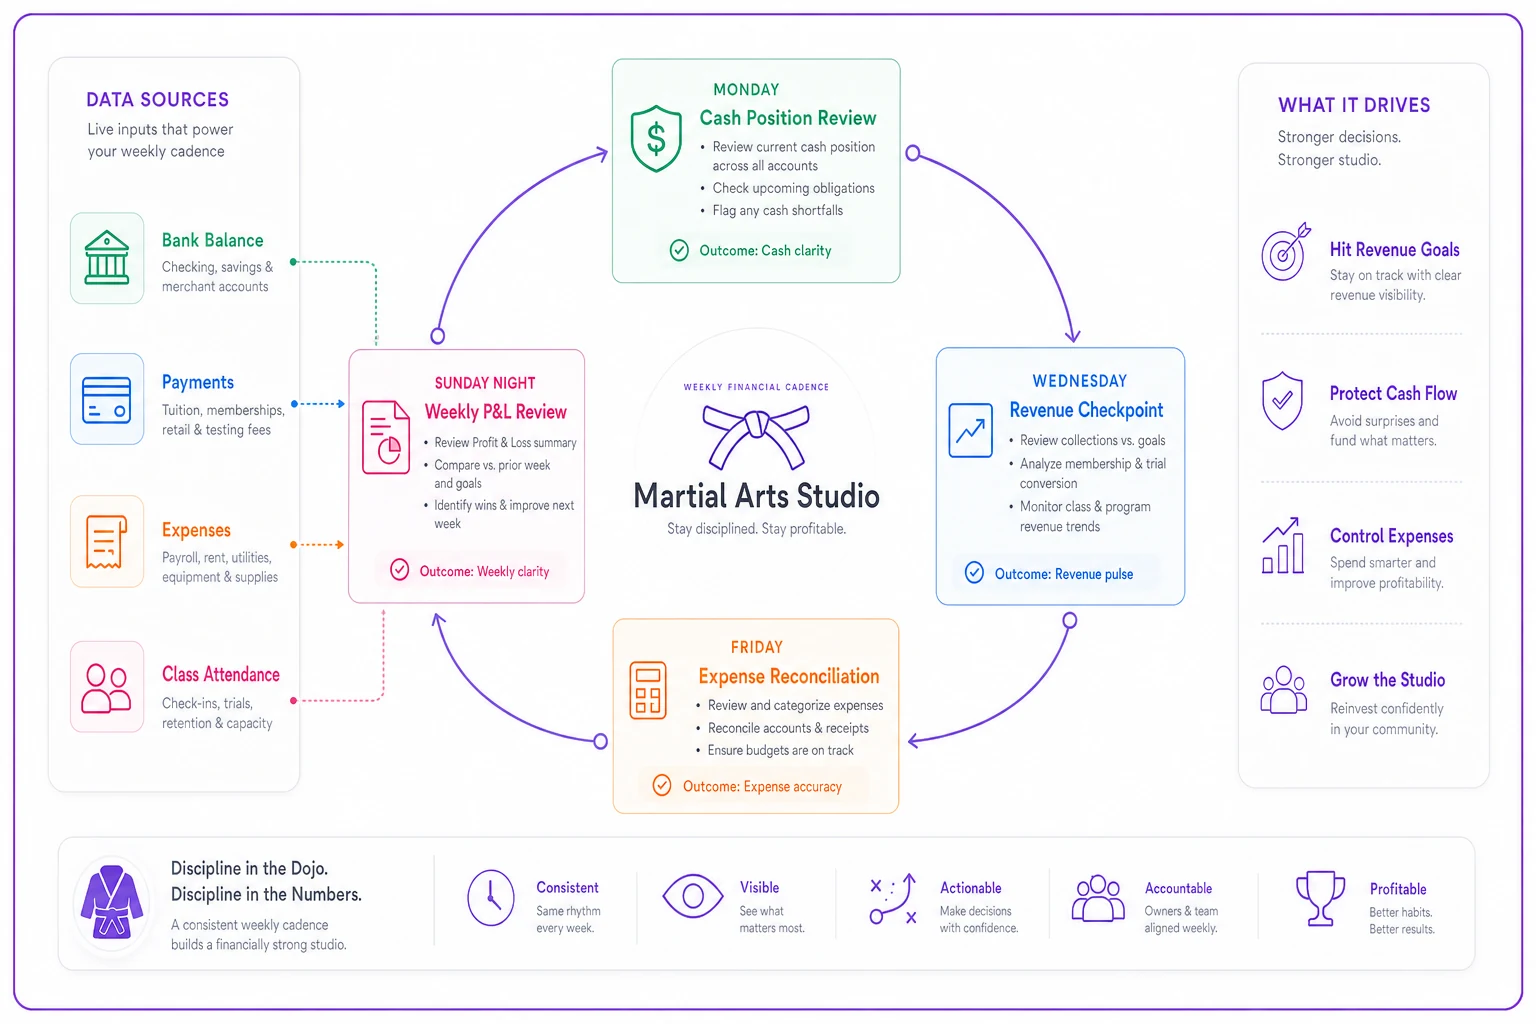
The value here isn't any single checkpoint. It's the rhythm. When you check weekly, you catch problems when they're small. The instructor showing up late and triggering overtime for coverage? You see it in week one, not month three. The new payment processor charging 0.5% more than you agreed to? Visible immediately.
Per-class P&L: the math that changes everything
Now the real work: understanding profitability at the class level. This isn't complex accounting. It's straightforward math that reveals which parts of your business actually make money.
Start with direct costs. For each class, calculate:
-
Instructor cost (hourly rate × class duration + 15 minutes prep/cleanup)
-
Facility cost (monthly rent ÷ total operating hours × class duration)
-
Insurance allocation (monthly insurance ÷ total student-hours × class student-hours)
-
Utilities (monthly utilities ÷ total operating hours × class duration)
-
Equipment depreciation (only for specialized classes)
Then revenue:
-
Number of attending students × their prorated class value
-
(Monthly membership fee ÷ average classes attended per month)
Here's what this looks like for a typical adult evening class:
| Cost Component | Calculation | Amount |
|---|---|---|
| Instructor | $35/hour × 1.25 hours | $43.75 |
| Facility | $4,200 ÷ 220 hours × 1 hour | $19.09 |
| Insurance | $450 ÷ 880 student-hours × 8 | $4.09 |
| Utilities | $320 ÷ 220 hours × 1 hour | $1.45 |
| Total Cost | $68.38 | |
| Revenue | 8 students × $12.50/class | $100.00 |
| Profit | $31.62 |
That same math for a specialized weapons class:
| Cost Component | Calculation | Amount |
|---|---|---|
| Instructor | $45/hour × 1.25 hours | $56.25 |
| Facility | $4,200 ÷ 220 hours × 1 hour | $19.09 |
| Insurance | $450 ÷ 880 × 3 + $50 rider | $51.53 |
| Utilities | $320 ÷ 220 hours × 1 hour | $1.45 |
| Equipment | $20/month allocation | $5.00 |
| Total Cost | $133.32 | |
| Revenue | 3 students × $12.50/class | $37.50 |
| Loss | ($95.82) |
That weapons class loses nearly $100 every time it runs. Over a year, that's close to $5,000 out of your pocket. For one class. This is exactly why "adding variety" to your schedule can quietly kill profitability.
Decision thresholds: when to cut, modify, or double down
Per-class data means nothing if you don't act on it. But cutting every unprofitable class isn't always the right move. Some losses are strategic. The key is knowing which.
Classes to immediately cut:
-
Losing money with fewer than 5 students after 6 months
-
Instructor cost exceeds 70% of revenue
-
Attendance declining for 3 consecutive months
-
No realistic path to profitability even at capacity
Classes to modify:
-
Losing money but attendance growing each month
-
Profitable at 8+ students, currently sitting at 5-6
-
High instructor cost but strong retention
-
Break-even with real upsell potential
Classes to invest in:
-
Profitable with a consistent waitlist
-
Margin above 40% with room to grow
-
Feed other profitable programs (kids basics → advanced)
-
Generate referrals beyond their direct return
Your class schedule directly affects capacity and growth potential, so these decisions ripple through your whole operation.
The modification options matter as much as the cut/keep decision. For a class with 6 students losing $30 weekly, you have choices: combine it with a similar class, move it to a cheaper time slot, bring in a lower-cost instructor, or raise prices for that specific program. The math tells you which lever to pull.
Price changes need their own governance. Too many studios have destroyed profitable programs with badly executed increases. The rule that works: never change pricing without running three scenarios—5%, 10%, and 15% increase—each with assumed student loss rates of 0%, 10%, and 20%. That's nine scenarios total. If all nine show improvement, move forward. If not, find a different lever.
Never change pricing without running three scenarios—5%, 10%, and 15%—each with assumed student loss rates of 0%, 10%, and 20%.
The modification options matter as much as the cut/keep decision. For a class with 6 students losing $30 weekly, you have choices: combine it with a similar class, move it to a cheaper time slot, bring in a lower-cost instructor, or raise prices for that specific program. The math tells you which lever to pull.
Copyable templates for immediate implementation
These are the templates that hold up across studios of different sizes. You don't need specialized software to start—a basic spreadsheet works fine early on.
Weekly Cash Flow Tracker
Create columns for:
-
Date
-
Starting bank balance
-
Revenue collected (by source)
-
Expenses paid (by category)
-
Ending bank balance
-
Variance from projection
-
Notes/actions needed
Track every single week without exception. Patterns show up fast—you'll quickly see that the third week is always tight because rent and payroll land together, or that Tuesday deposits consistently process late.
Per-Class P&L Template
One sheet per class:
-
Class name and time
-
Instructor assigned
-
Capacity
-
Average attendance
-
Direct costs (itemized)
-
Actual revenue (not theoretical)
-
Contribution margin
-
3-month trend
-
Decision status (keep/modify/cut)
Update monthly, review weekly. When attendance drops two weeks straight, you'll catch it before it becomes a real problem.
Promotion Governance Checklist
Before any promotion goes live:
-
Calculate cannibalization rate (how many would've paid full price)
-
Set maximum discount depth (usually 30%)
-
Define success metrics beyond raw signup count
-
Lock in an end date with an enforcement plan
-
Document who can approve and who can override
This prevents the "permanent special" problem where your discounted rate slowly becomes your actual rate.
Monthly Financial Operations Review
Block two hours each month to go through:
-
All per-class P&Ls
-
Instructor cost ratios
-
Facility utilization rates
-
Promotion performance
-
Accounts receivable aging
This isn't bookkeeping. It's operational intelligence. There's a real difference.
Where automation actually helps
Once you've built these rhythms manually, you'll start seeing exactly where AI-powered operational software makes a real difference. That 90-minute Monday cash review? An automated system handles it in seconds, surfacing only the anomalies that need your attention.
More importantly, connecting your financial data to operational triggers in real time changes how you respond to problems. When a class drops below its profitability threshold, the system flags it and suggests schedule adjustments. When payment failures spike, it kicks off outreach immediately rather than waiting for end-of-month cleanup.
The bigger advantage, honestly, is consistency. Manual reviews get skipped during busy weeks. Spreadsheets don't get updated when you're dealing with an instructor calling out sick. Automated systems maintain that financial cadence regardless of what's going on operationally—they become the early warning layer, catching those $50 weekly losses before they quietly turn into $2,600 annual ones.
Studios that move to integrated financial operations platforms tend to see margin improvements somewhere in the 15–20% range within six months, not from raising prices or slashing costs, but from making better-informed decisions more consistently.
Making financial operations sustainable as you scale
Everything above works well for a single location running 10–15 classes weekly. But when you're at 40 classes across multiple locations, execution has to evolve.
Delegate the data collection, not the analysis. Managers can handle attendance tracking, expense entry, and spreadsheet updates. But the weekly review needs to stay with you. That's where cross-location patterns emerge—like recognizing that the profitable Saturday morning program at Location A would fill a dead slot at Location B.
As you grow, shift to exception-based reporting. Instead of reviewing every class every week, set thresholds that trigger alerts: margin below 20%, attendance under 50% of capacity, instructor costs exceeding 45% of revenue. You focus on what's flagged and trust that what's working keeps running.
Set clear escalation levels. Lead instructors handle scheduling adjustments with less than $500 monthly impact. Location managers can approve promotions up to 20% off. Anything beyond those thresholds needs your sign-off. This prevents both decision paralysis and the unauthorized moves that quietly wreck your unit economics.
Studios that scale their financial operations successfully tend to share one characteristic: they treat financial review as core operational work, not administrative overhead. Every operational decision is ultimately a financial decision. When that becomes instinctive, the weekly rhythms feel natural, the per-class analysis becomes routine, and the profitability improvements follow.
Start with the Monday morning cash review. Add per-class P&L tracking next month. Build the full weekly rhythm over the following quarter. Every week you operate without knowing which classes make money is another week of losses compounding invisibly.
Start with the Monday morning cash review. Add per-class P&L tracking next month. Build the full weekly rhythm over the following quarter. Every week you operate without knowing which classes make money is another week of losses compounding invisibly.
Ready to elevate your dojo operations?
Join 500+ martial arts studios using Dojoyly to save time, reduce scheduling conflicts, and improve member engagement.